Getting to know the dashboard
Upon logging into heatfolio you will be redirected towards the Dashboard of the application, containing the most recent and relevant data for the period displayed.
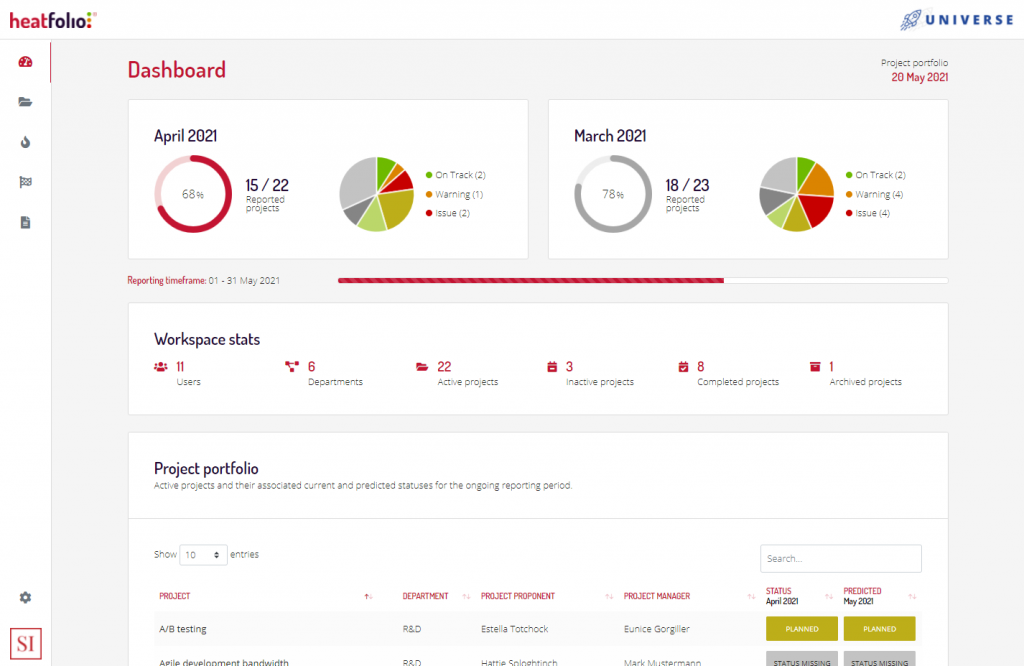
The Dashboard page.
The top-right position of the page contains the current date and references the status of your portfolio at this moment of time.
Comparing the ongoing and previous reporting periods
Portfolio status to date: the first section of the Dashboard includes two elements, both of them presenting the same data elements for two different time periods. You can see the progress of the status reporting to date in the left side of the screen, which references the current status of projects that is collected in the present month for the end of the previous month (see What is the current status of a project?).
The first graphic in this section shows the amount of reported projects out of the total available to you, while the second graphic displays the summary of the current status registered for each project. As projects become reported, these graphics will be updated until they reach a 100% status submission rate. The pie charts display a distribution of the current statuses reported for each period.
Portfolio status in the prior month: the second section of the Dashboard includes the same two elements we met before in the previous paragraph, which references the current status of projects recorded the last month for its associated period.
Example: If you log in the application in March, you will see the left side section referencing the current status that is collected for the end of the previous month, which is February. On the right side, you will see the current status recorded for projects in the previous month, February, for its associated period, which is end of January. In this way, you can see a comparison of how the status collection evolves this month, as compared to how it did the last month.
Status reporting timeframe
Status reporting is enabled in a workspace between two fixed dates each month (e.g. between the 1st day and the 15th or between the 1st day and the last one in the month). The second element in the Dashboard shows a loading bar representing the time elapsed from the beginning of the reporting period and the time left in which the status of projects can be reported.
The reporting timeframe will have come to an end once this progress bar reaches a full level (filled only in one color) and new or changes to the status reports will not be accepted anymore for the associated reporting period.
Workspace stats
Available only to the user roles of “Administrator” and “Supervisor”, this section displays relevant information about your workspace, such us the number of users, the number of departments or projects. Additionally, you can see also the active, pending, completed and archived projects.
Projects portfolio
The last section available in the Dashboard displays all the active projects in the workspace, together with their associated current and predicted status. Here you can browse the projects that have not been reported yet or spot projects that possess a different predicted status than the current status, in order to take actions accordingly, if needed.
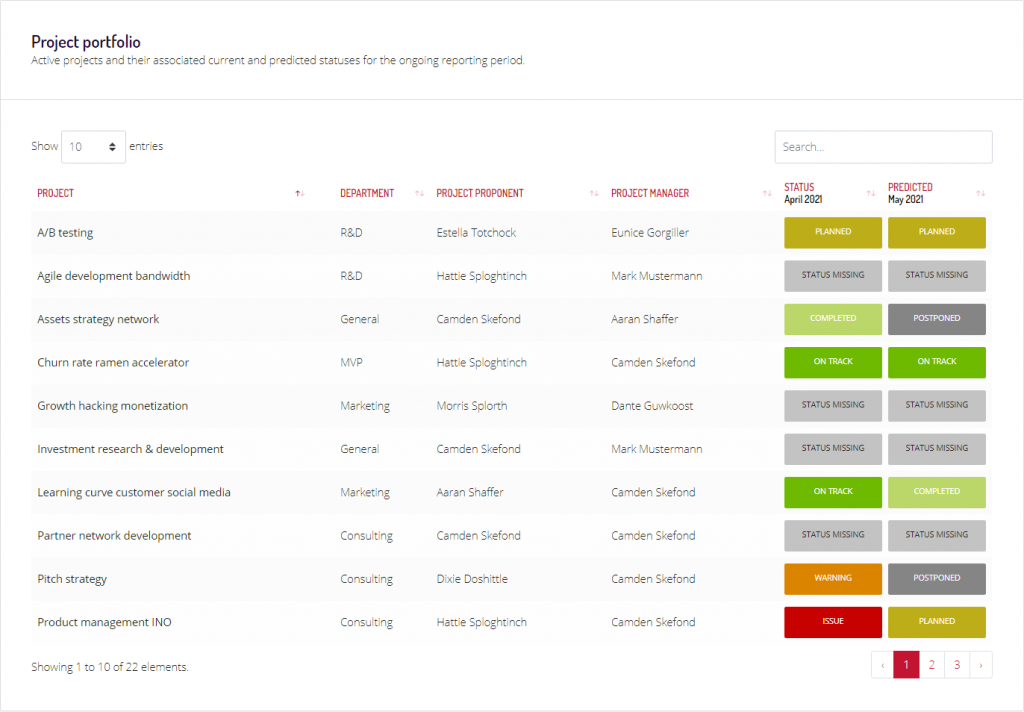
Projects portfolio section at the bottom of the Dashboard.
Example: As part of the top management of an organisation (e.g. Supervisor role in the workspace), you can quickly see if a project was “On track” at the end of the previous month, but for the predicted status that same project estimates an “Issue” status. Actions can be quickly drafted in this way to mitigate any potential issues and put the project back “On track” until the end of the month. The status reports collected next month will show then two consecutive “On track” statuses for the previous periods and potential flaws in a project would have been resolved.
The project portfolio view can be alphabetically sorted (ascending or descending) based on each column. Additionally, you can also search for particular items through the top-right search bar or choose a different display amount of items through the top-left screen option.